ANALYTICAL SPECTROSCOPY
by Raymond P. W. Scott
D.Sc., F.R.S.C., C.Chem., C.Sci. F.A.I.C, F.C.S.
Essential Information for the Analytical Chemist
Specialising in custom-designed, precision scientific instruments, built, programmed and calibrated
to the most exacting standards. The range includes precision dataloging barographs,
with built-in statistical analysis, Barographic Transient Event Recorders
and computer-interfaced detectors and sensors
for environmental monitoring & process control.
A site dedicated to scientific techniques, experimental methods, &
investigative tools for the inventor, researcher
and laboratory pioneer. Articles on glassblowing, electronics, metalcasting, magnetic
measurements with new material added continually. Check it out!
www.drkfs.net
Sample Effects
Historically,
samples have been prepared as solutions in liquids, as ‘mulls
and as vapours in a gas. Modern techniques include reflectance, such
as attenuated total reflectance, diffuse and Specular Reflectance. In
general, spectra of the same materials taken as a solution in a
liquid are very similar to that taken as a vapour sample in a gas. In
fact, Welti [1] suggests vapour spectra might be considered as liquid
spectra taken at infinite dilution. This is only true, however, if
there is no interaction between the sample and solvent. The vapour
and liquid film spectra of n-hexanol are shown in figure 7.
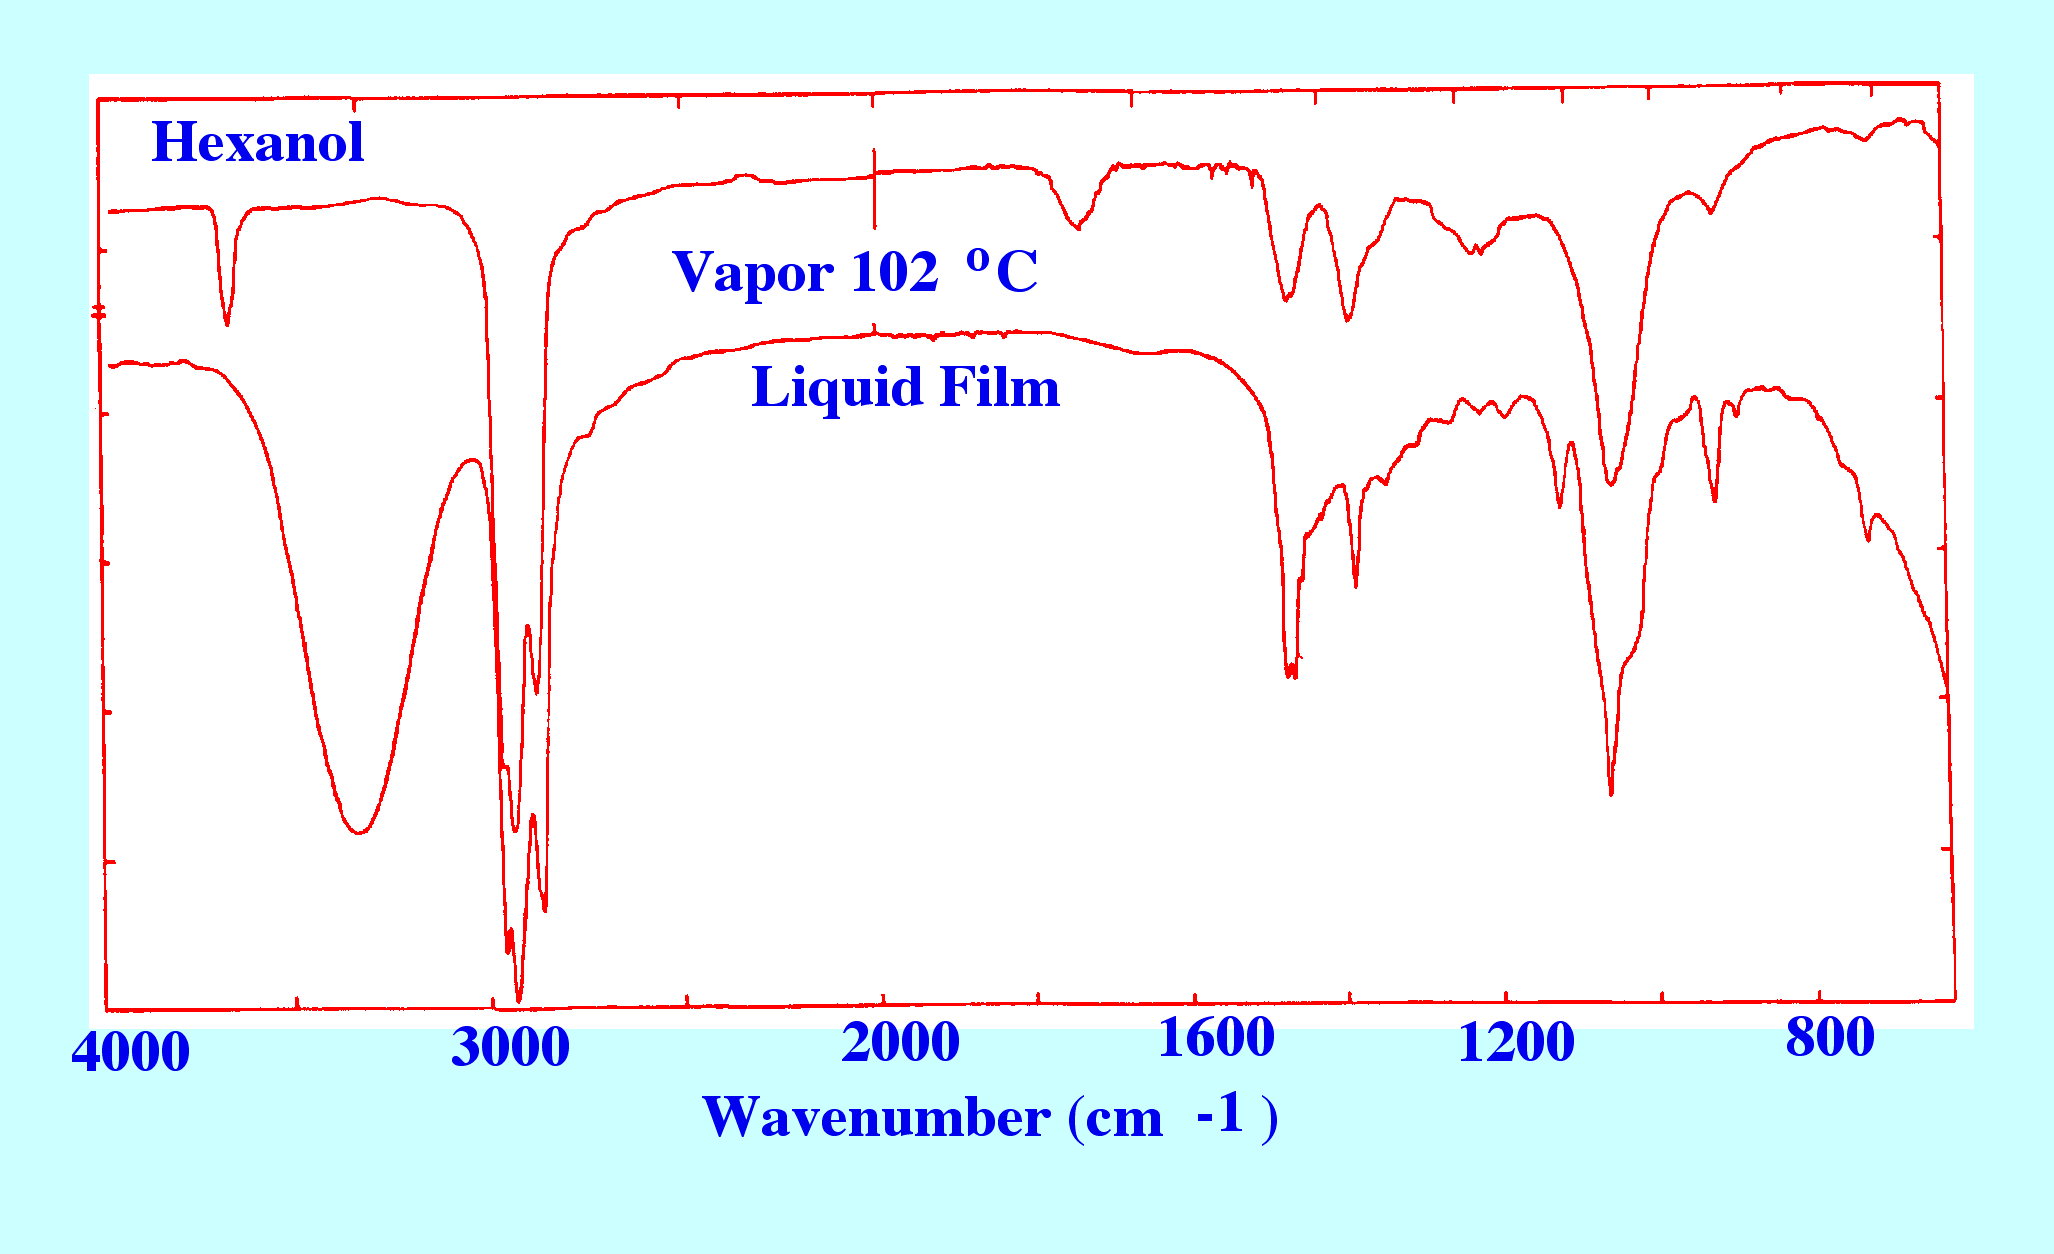
It
is seen that the two spectra are indeed very similar and that vapour
spectra can be confidently used for the confirmation of sample
identity, providing a reference vapour sample Spectrum is available.
It should be noted, however, that the disperse peak at about 3400
wave numbers, shown in the liquid sample Spectrum, demonstrates the
effect of intra-hydrogen bonding between the OH groups of the
n-hexanol (and possibly the presence of water in the sample or
solvent), which is not present in the vapour Spectrum.
Correlation
charts can be constructed to help assign specific absorption bands to
certain chemical bonds or groups present in an unknown molecule. An
example of such a correlation chart, after Stuart [2], is shown in
figure 8.
The
presence of certain bands at specific wave numbers (frequencies or
wavelengths) helps identify the major groups present in the molecule
but gives very little evidence of the size of the molecule or the
manner in which the actual groups are joined. The interpretation of
spectra requires considerable skill and, unless the analyst is also
an experienced spectroscopist, verification should be sought to
confirm any conclusions that are drawn from the spectra of an unknown
substance, particularly if there is no reference Spectrum available.


About the Author
RAYMOND PETER WILLIAM SCOTT was born on June 20 1924 in Erith, Kent, UK. He studied at the
University of London, obtaining his B.Sc. degree in 1946 and his D.Sc. degree in 1960.
After spending more than a decade at Benzole Producers, Ltd. Where he became head of
the Physical Chemistry Laboratory, he moved to Unilever Research Laboratories as
Manager of their Physical Chemistry department. In 1969 he became Director of Physical
Chemistry at Hoffmann-La Roche, Nutley, NJ, U.S.A. and subsequently accepted the position
of Director of the Applied Research Department at the Perkin-Elmer Corporation, Norwalk, CT, U.S.A.
In 1986 he became an independent consultant and was appointed Visiting Professor at Georgetown
University, Washington, DC, U.S.A. and at Berkbeck College of the University of London; in 1986
he retired but continues to write technical books dealing with various aspects of physical chemistry
and physical chemical techniques. Dr. Scott has authored or co-authored over 200 peer reviewed
scientific papers and authored, co-authored or edited over thirty books on various aspects of
physical and analytical chemistry. Dr. Scott was a founding member of the British chromatography
Society and received the American Chemical society Award in chromatography (1977), the
M. S. Tswett chromatography Medal (1978), the Tswett chromatography Medal U.S.S.R., (1979),
the A. J. P. Martin chromatography Award (1982) and the Royal Society of Chemistry Award in
Analysis and Instrumentation (1988).
Dr. Scott’s activities in gas chromatography started at the inception of the technique,
inventing the Heat of Combustion Detector (the precursor of the Flame Ionization Detector),
pioneered work on high sensitivity detectors, high efficiency columns and presented fundamental
treatments of the relationship between the theory and practice of the technique.
He established the viability of the moving bed continuous preparative gas chromatography,
examined both theoretically and experimentally those factors that controlled dispersion
in packed beds and helped establish the gas chromatograph as a process monitoring instrument.
Dr. Scott took and active part in the renaissance of liquid chromatography,
was involved in the development of high performance liquid chromatography and invented
the wire transport detector. He invented the liquid chromatography mass spectrometry
transport interface, introduced micro-bore liquid chromatography columns and used them
to provide columns of 750,000 theoretical plates and liquid chromatography separations
in less than a second.
Dr. Scott has always been a “hands-on” scientist with a remarkable record of accomplishments in chromatography ranging from hardware design to the development of fundamental theory. He has never shied away from questioning “conventional wisdom” and his original approach to problems has often produced significant breakthroughs.